
Open any coin on DexScreener and you get a wall of numbers. Three of them do most of the work before a buy: liquidity, makers and sells. This guide goes down the page so you know what each number is, where it comes from, and which ones can be faked. It builds on Market Cap vs Liquidity, What Is Slippage? and What Is a Liquidity Pool?.
For the full video explanation, check out this YouTube video:
The Example Page
The numbers below are an example, not a real coin: a pump.fun coin that has just graduated, with SOL taken as $100 to keep the dollars round.
| Number | Example |
|---|---|
| Price (USD) | $0.000041 |
| Price (SOL) | 0.00000041 |
| Liquidity | $17K |
| FDV | $41K |
| Market cap | $41K |
| Transactions (24h) | 2,400 |
| Buys / sells | 1,300 / 1,100 |
| Volume (24h) | $90K |
| Makers | 600 |
| Pair age | 3 hours |
Price
The price is shown twice: once in dollars, and once in the coin it trades against, usually SOL.
That price comes from one pool: one side divided by the other. A coin with several pools has a page for each, and each page can show a slightly different price and very different liquidity. Check that you are on the pool you will actually trade in.
Liquidity
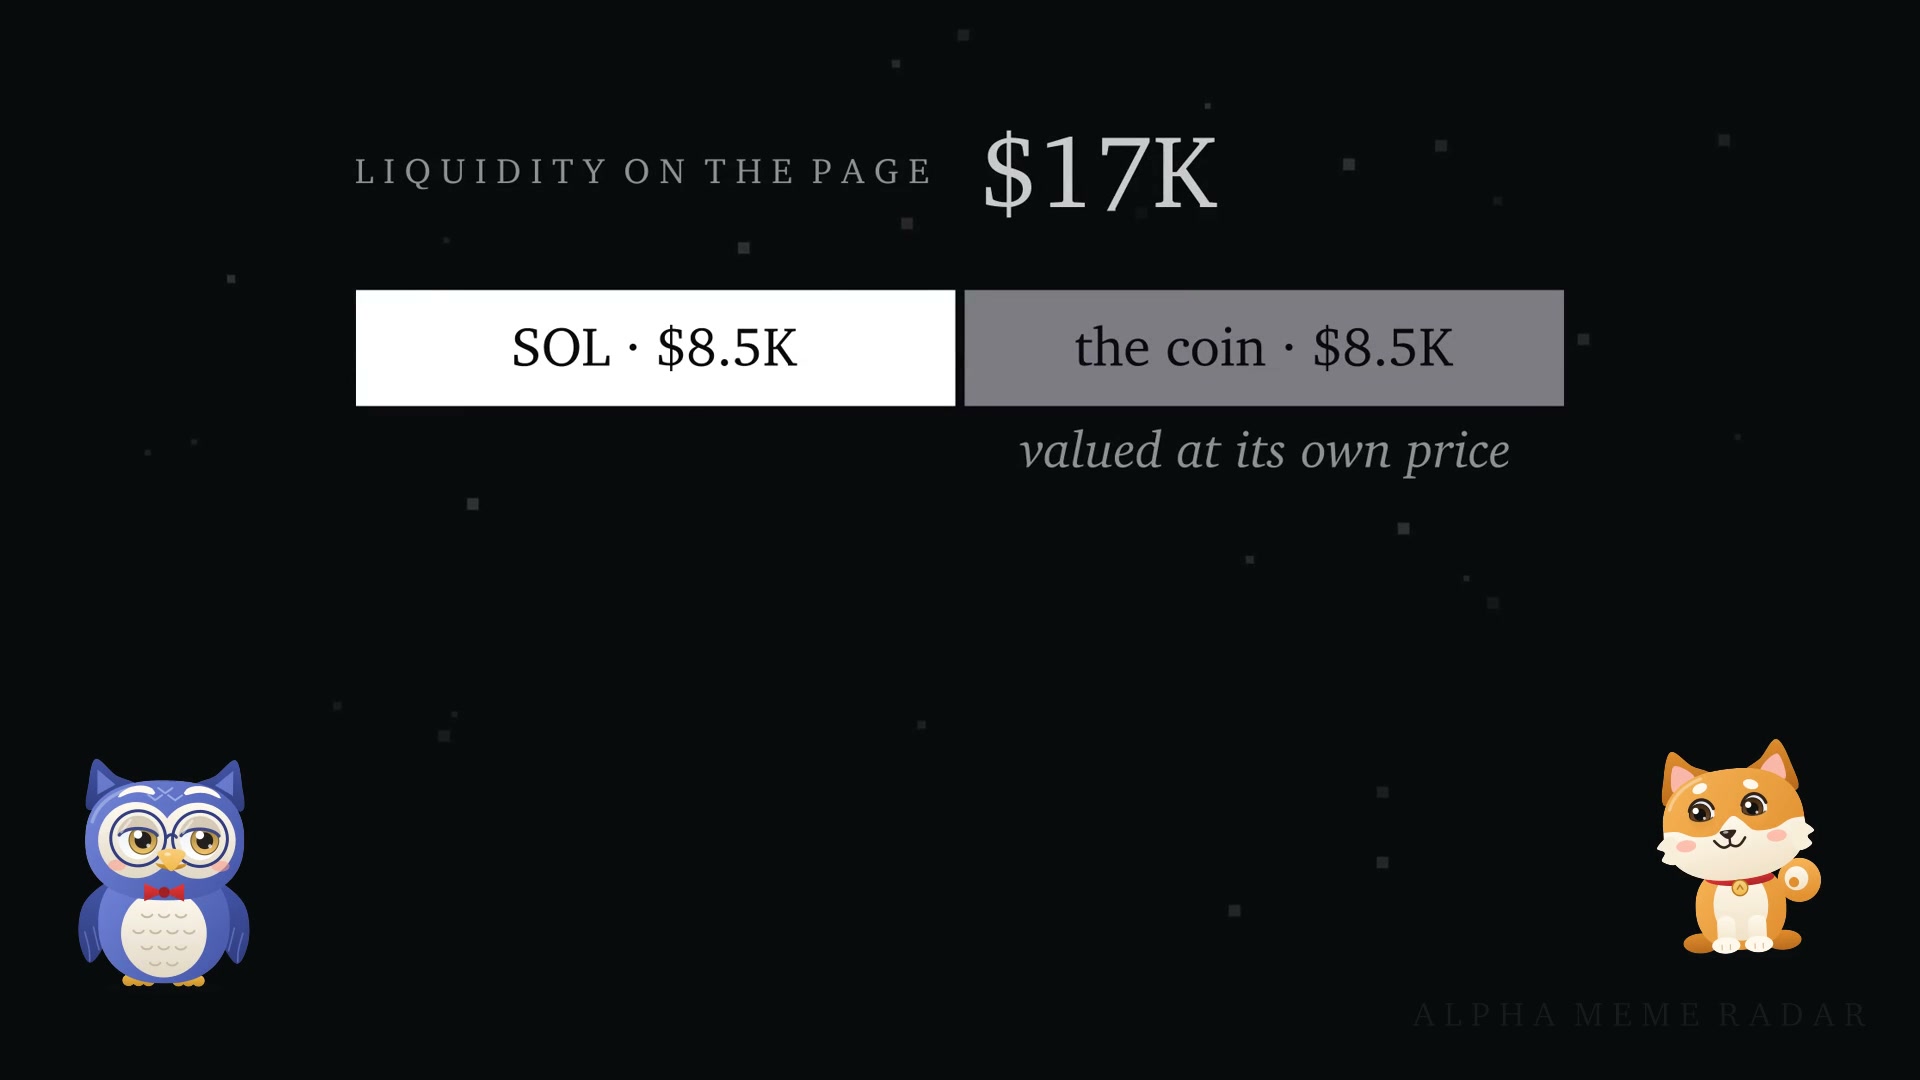
Liquidity is not the money in the pool. It is both sides of the pool added together. On a standard pool, half of it is the coin itself, valued at its own price.
The money you can sell into is the other half. On the example page, $17K of liquidity means about $8,500 of SOL.
So cut the liquidity in half, then set your trade next to it:
| Your buy | Next to the SOL side | Fills short by |
|---|---|---|
| $85 | 1% | about 1% |
| $850 | 10% | about 9% |
| $4,250 | 50% | about 33% |
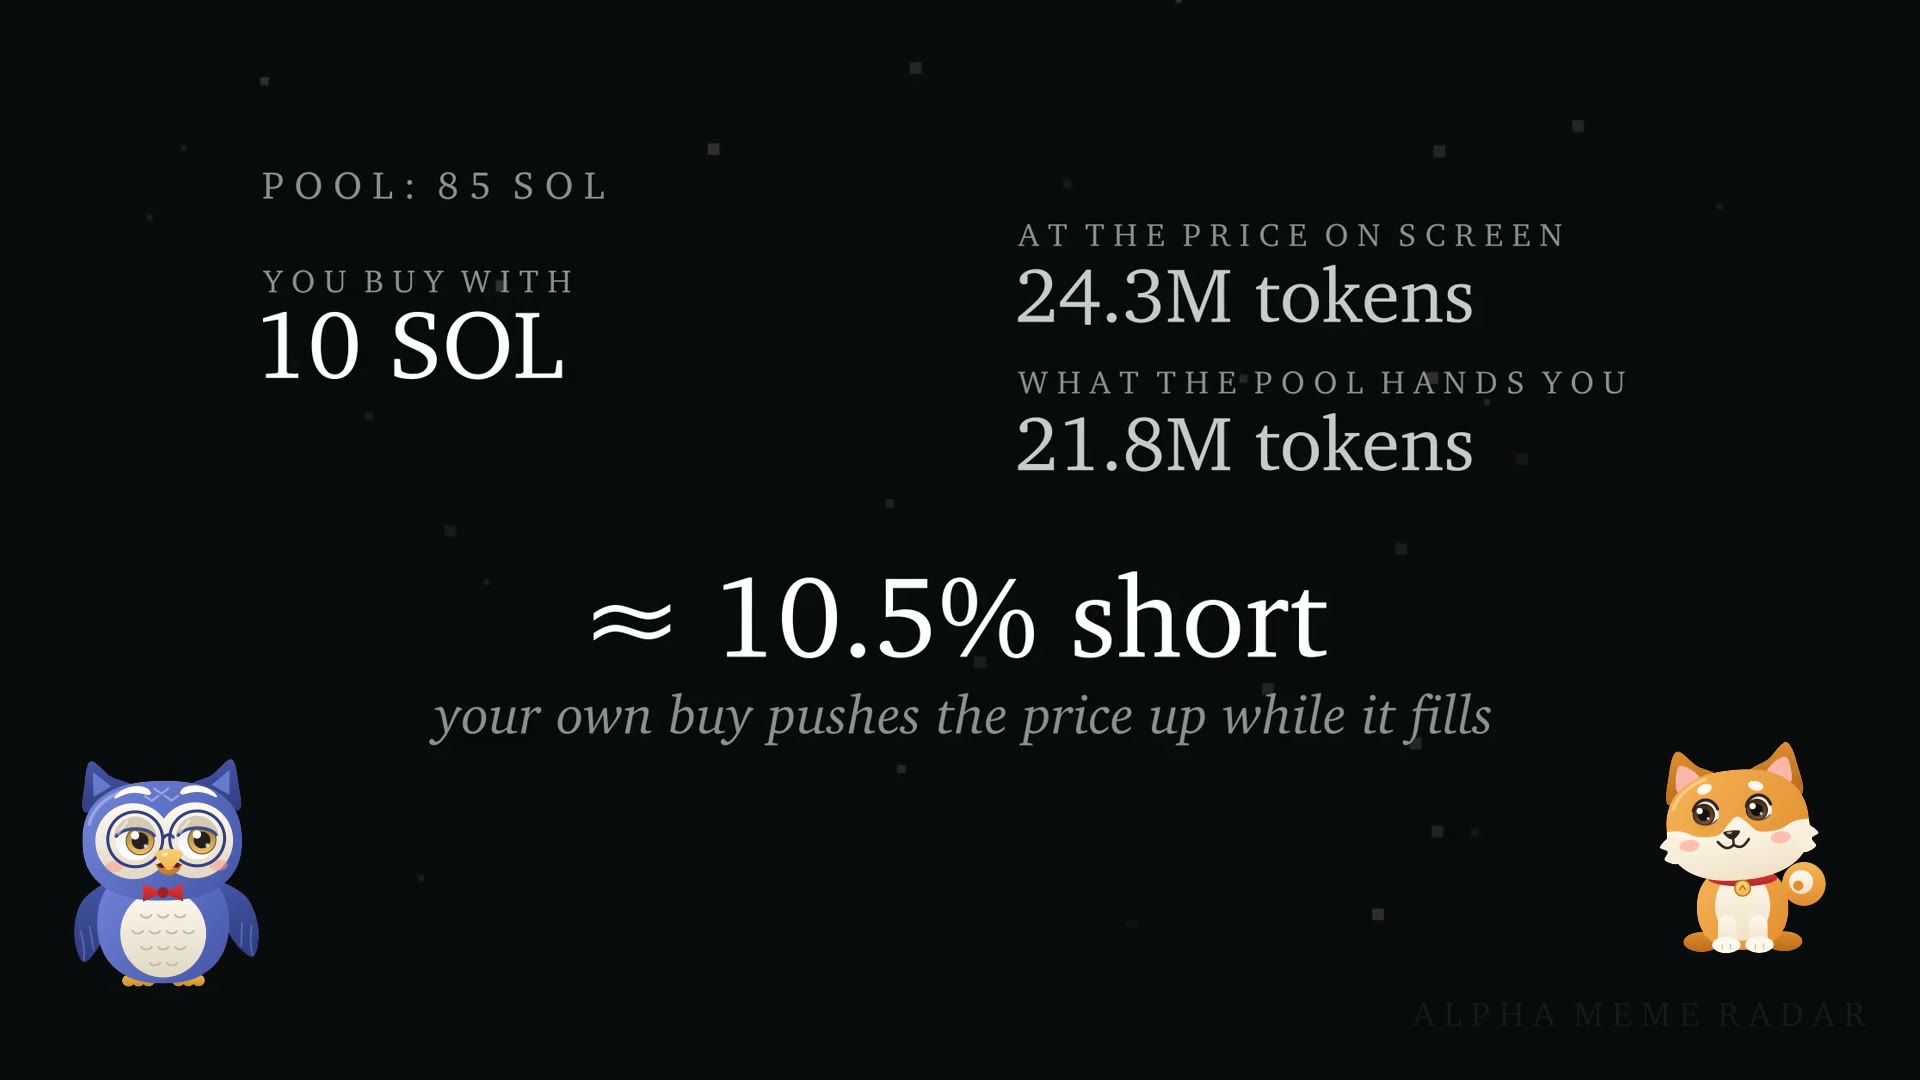
That gap is price impact, covered in What Is Slippage?. Fees come on top.
The half-and-half rule holds for standard pools. Concentrated or one-sided pools can show a large liquidity figure that is almost all the coin itself, with very little SOL or USDC behind it.
Market Cap and FDV
Both are the price times a number of tokens:
- FDV (fully diluted valuation) counts the whole supply, minus anything burned.
- Market cap counts only the tokens in circulation.
On a pump.fun coin the whole supply of one billion exists from the start, so the two usually match. When FDV is much bigger than market cap, a lot of the supply is not in circulation yet. DexScreener takes that circulating figure from what the project reports, so treat it as a claim.
Either way it is a price tag, not money in the coin. Market Cap vs Liquidity explains why.
Transactions, Buys, Sells and Volume
These are counted over a window: 5 minutes, 1 hour, 6 hours or 24 hours.
- Volume is the dollars traded in that window.
- Buys and sells count trades, not people. One wallet can make any number of them.
Makers
Makers is the number of different wallets behind those trades. It matters because volume can be faked. A bot can buy and sell the same coin all day.
Chainalysis studied suspected wash trading on Ethereum, BNB Chain and Base in 2024. It found up to $2.57 billion of it, and one address that made more than 54,000 buy-and-sell trades of almost identical amounts. The study flags patterns, not proven intent, and it did not cover Solana, but the trick is the same on any chain.
So set the trades next to the makers:
| Trades | Makers | Trades per wallet | Looks like |
|---|---|---|---|
| 2,400 | 600 | 4 | A crowd |
| 2,400 | 20 | 120 | A few bots |
Makers can be padded too. The same study found one operator running 22,832 addresses. A healthy makers count is a good sign, not proof.
Sells Next to Buys
If a page shows hundreds of buys and almost no sells, ask whether anyone can sell at all. That is the pattern of a honeypot.
Pair Age
Pair age is how long this pool has existed. Every number on the page has only that much history behind it. A 24-hour volume on a pair that is three hours old is three hours of trading.
Where the Numbers Come From
DexScreener says its data comes straight from the blockchains it tracks and is processed automatically, with no human moderation. Tokens are listed as soon as they are in a pool and have one transaction. So the page shows what happened. It cannot tell you whether the trades were honest.
The boosts shown by a coin's name are bought. A project pays for them to raise its trending score for a while. They are an ad, not a rating.
Three Numbers to Check Before You Buy
1. Liquidity, cut in half. Compare it with the size of your trade.
2. Makers next to trades. Lots of trades from a few wallets is a warning.
3. Sells next to buys. If nobody is selling, find out why.
What This Guide Does Not Cover
The chart itself, the security and audit panel, the holders tab (see What Is Holder Concentration?) and the trending list. The exact layout of the page changes over time, so this guide describes what each number is rather than where it sits. The example numbers are made up, and the price-impact figures leave out fees.
Key Takeaways
- Liquidity counts both sides of the pool. On a standard pool, only half of it is money you can sell into.
- FDV and market cap are both price times tokens. They are price tags.
- Buys, sells and volume count trades. Makers counts wallets.
- Volume can be faked, and makers can be padded, so read them together.
- Before you buy: half the liquidity next to your trade, makers next to trades, sells next to buys.
This article is for education only and is not financial advice.