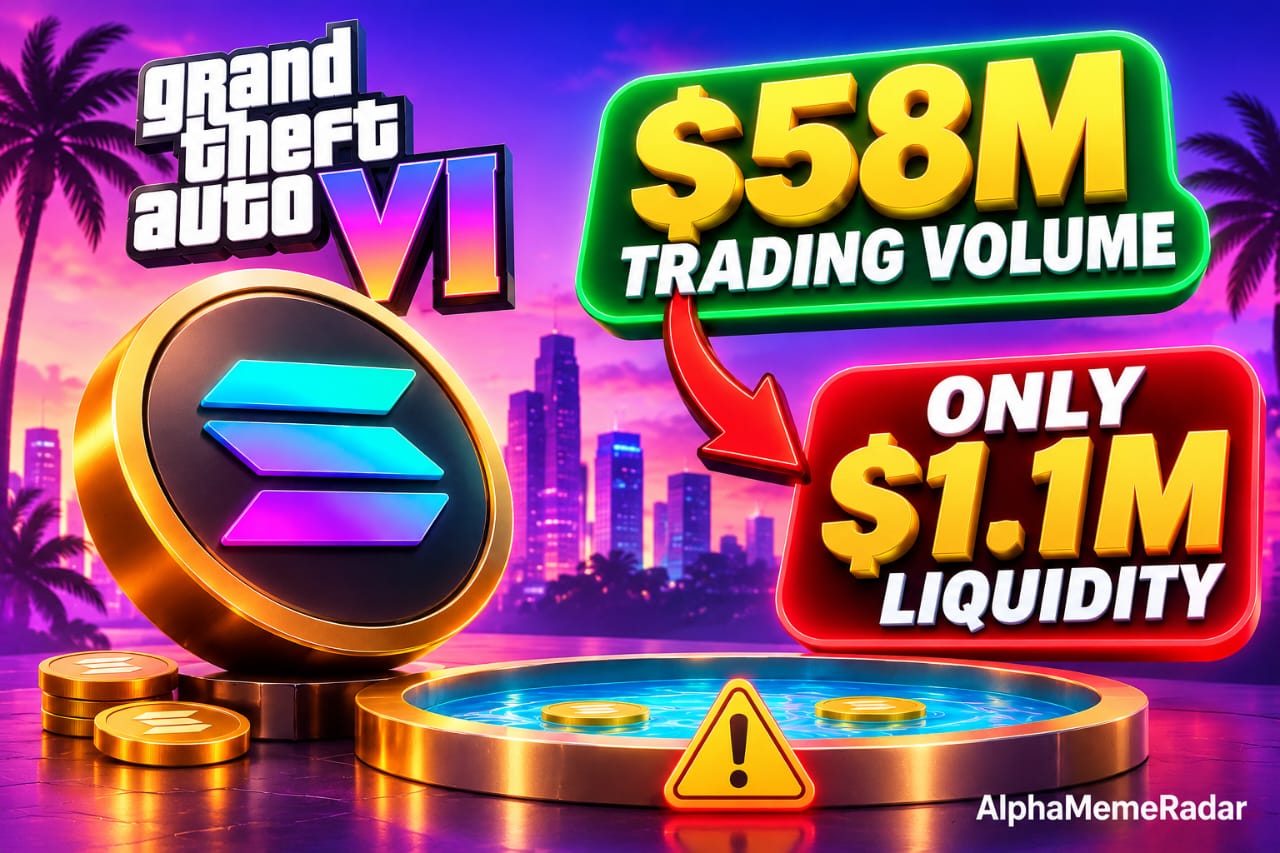
Twenty-three GTA 6-themed Solana tokens moved $58 million in seven days, yet just $1.1 million of liquidity sits behind them. The pool data shows who can sell before Rockstar’s November 19 launch.
Twenty-three tokens with just $58 million in trading and $1.1 million of liquidity to exit through. When Rockstar’s game lands on Thursday, only some holders will get out at the price they see on screen.
Seven Days, 23 Tokens, $58 Million
Rockstar has confirmed that Grand Theft Auto VI launches Thursday, November 19, 2026, on PlayStation 5 and Xbox Series X|S, and the countdown has dragged Solana’s memecoin crowd along with it. On-chain data compiled by LAMBLE shows 23 GTA 6-themed tokens traded about $58 million over the seven days through 07:54 UTC on November 17. That is a 77.8% jump from the week before, which puts the earlier figure at roughly $32.6 million.
The group covers indexed Solana pools, not the whole market, and its membership was reconstructed after the fact. About $18.8 million of the total traded in the last 24 hours, and GTA6CAT led the pack with roughly $11.7 million in weekly volume.
One fact belongs ahead of every price chart. None of these tokens has any official link to Rockstar Games or Take-Two Interactive, and nothing from either company mentions a coin or token. The tokens ride the release date, not the game.
The Liquidity Gap Behind the Volume
Volume sounds like depth, but it isn’t. The same dataset puts the 23 tokens’ combined circulating market cap at about $28.6 million, with only $1.1 million of liquidity across their top trading pairs. Liquidity is the money sitting in pools that buyers and sellers trade against.
Three ratios, all worked out from those figures, tell the story. Liquidity equals about 3.8% of market cap. Weekly volume is roughly twice the market cap, so the group’s value turned over about twice in seven days. And weekly volume is around 53 times the liquidity, meaning thin pools handled 53 times their own size in trades.
Turnover looks frantic, too. Tokens whose 24-hour volume topped 10 times their market cap produced 43% of the cited daily volume. A token that trades 10 times its value in a day isn’t passing between long-term holders, and some of that activity may be artificial.
Spread $1.1 million across 23 tokens and the average pool holds about $48,000. Assume half of that sits on each side of a standard constant-product pool. A $5,000 sale would then fetch roughly $4,140, a loss near 17% from slippage alone. That is an illustration, not a measured trade, but it shows why a market cap figure overstates what holders can actually collect.
Inside the GTA6 Token’s Pool
The Solana token called GTA6 offers the clearest look at the exit problem. Its contract is 4kjruqGHDsSqkMdFfCjV7Vb62HPFhtXyWc2t6JpQzDnz, and its trading pages on DexScreener and GMGN carry the numbers below. As of 10:34 WAT on November 18, the token traded at about $0.0152 on a $15.2 million market cap, down 7.87% over 24 hours.
The main pool is a Meteora DLMM pair against SOL, created about 18 days and 19 hours earlier, and it holds $203,000. Of that, roughly $180,000 is SOL (2,414 SOL) and only $23,000 is GTA6 (1.52 million tokens, about 0.15% of the roughly 997 million supply). Liquidity works out to about 1.3% of market cap, a little over a third of the 3.8% group average, although the group dataset is separate and the two figures aren’t directly comparable.
That SOL is the exit. When holders sell, the SOL in the pool is what pays them. Sells over the last 24 hours totaled $3.1 million, about 17 times the pool’s SOL. The pool’s age adds a wrinkle: it was created around October 30, the day after the token’s reported $30 million peak, so the pair’s age says nothing about when the token itself launched.
A Round Trip From $30 Million to $3.5 Million and Back
GMGN data reported on November 17 showed the token up 110% in 24 hours, to a $15.4 million market cap on $8.8 million of volume. A day earlier it stood near $7.3 million. The same data put its peak at $30 million on October 29, followed by a slide as low as $3.5 million, a drop of about 88%.
At $15.2 million, the token has climbed about 340% from that low and sits at roughly half its peak. Anyone who bought near the October high and held is still down by half, while anyone who bought near the low has more than quadrupled. One token produced both outcomes inside three weeks, and timing, not the game, decided who came out ahead.
Names add confusion here. Another token with the same ticker, launched on pump.fun under a different contract, has traded under $2 million in recent snapshots. Confirm the contract address before comparing or buying anything.
Who Buys First and Who Sells First
The DexScreener snapshot offers a partial answer on who is selling. Over 24 hours the token logged 98,908 transactions: 59,623 buys and 39,285 sells, from 7,903 buyers and 5,651 sellers across 11,294 traders. Buy volume and sell volume each came to $3.1 million, so dollar flows roughly offset even as the price slipped.
Three details stand out. The average buy was about $52 and the average sell about $79, so sellers moved roughly half again as much per trade, which suggests many small buyers matched by fewer, larger sellers. About 2,260 wallets both bought and sold within the same day, one in five traders. And 24-hour volume of $6.3 million equals about 41% of market cap, so a big share of the token’s value changed hands in a single day.
Beyond these totals, early buyers on launch tokens tend to fall into familiar groups. Creators and insiders hold supply from the first block, snipers buy within seconds, and bundlers split purchases across wallets funded from one source. Pump.fun data shows how rare success is: as of November 9, its 24.4 million cumulative launches included only 312 tokens above a $100,000 market cap, about one in 78,000.
August offers a preview of what a sell-off looks like. According to Dropstab’s research, the CYBERLEEK token launched on Pump.fun on August 15, hit a market cap near $25 million on August 23, and saw its creator cash out $250,000 to $270,000 on August 27, though sources conflict on the figure. The token fell 46% within 24 hours, taking its market cap to roughly $7 million.
How to Check the Wallets Before November 19
Anyone holding or considering this token can check the early wallets in a few minutes using the links above. Start with the creator wallet: does it still hold supply, and has it sold? Next, look at the top ten holders’ share of supply, leaving out pool accounts, to see how concentrated the token is. Then review the first buyers, since a handful of wallets that bought in the opening seconds may still be holding. Finally, compare liquidity with market cap. A token worth $15 million with about $200,000 in its main pool can’t absorb big exits.
DexScreener lists the token’s audit status as “no issues” but warns that audits may not be fully accurate, so treat that label as a starting point. Launch day adds its own risk, because prices can swing either way as the release lands, and in a thin pool the first sellers set the price for everyone behind them. The only safe position size is one that can go to zero without hurting.
In the end, the $58 million figure says more about attention than about value. Volume measures turnover, not capital flowing in, and a pool this shallow can’t support the market caps on screen. Holders who plan to exit should work out their slippage before Thursday, not on it.
If you are new to this corner of crypto, it also helps to know what a rug pull is and how creators pull one off. Alpha Meme Radar has a plain-English guide on what a rug pull is, including the warning signs to look for before you buy.